


Monthly Commentary May 2014
The Appian Fund posted a gain in May of 0.24%, as the Fund, and hedge funds in general, rebounded from two consecutive monthly losses. Market sentiment was largely positive during the month as investors elected to reject the theory “Sell in May and Go Away.”
Economic and Financial Market Overview
Both the Dow Jones Industrial Average and the S&P 500 ended the month in record territory. The S&P 500 returned 2.19% in May on the strength of generally positive news about the global economy. In the U.S., 217,000 jobs were added in May and reached the milestone of restoring the almost nine million jobs lost during the Great Recession. Manufacturing data for the month was also positive, as the Institute for Supply Management’s manufacturing index registered at 55.4, up from 54.9 in April. Despite generally constructive economic data, the 10-year U.S. Treasury, which has been range-bound between 2.5 and 3.0 thus far in 2014, dipped down to 2.45 at the end of May, its lowest level since last June.
U.S. Housing also showed signs of pulling out of a brief slump in May. Sales of existing homes rose more than expected in May. The inventory of properties for sale was the highest in more than 1.5 years, which helps to temper price increases in the wake of increased demand. Persistent low interest rates have spurred housing demand, although the market has been very susceptible to the threat of rising interest rates. (The housing recovery all but stalled last June when the Federal Reserve began speaking about tapering QE3.) A further potential drag on housing is that the Millennial Generation seems to have chosen renting over owning. In May, first time buyers accounted for only 27% of transactions; 40% is considered typical.
Volatility has remained at historical lows. True, the market news flow has taken on a positive leaning of late, and the situation in the Ukraine has receded into the background for now. Nevertheless, the suppressed volatility is noteworthy. As of this writing, the S&P 500 has gone over 50 consecutive days without a 1% move, positive or negative, which has not occurred since 1995. Also as of this writing, the VIX was hovering near 11. Since 1990, the VIX has closed above 20 47% of the time, and below 14 less than 20% of the time.
With that in mind, the relevant question for the Appian Fund and its performance is: when will the volatility return? We have written often that increased (or at least normalized) volatility would be beneficial for the Fund’s performance, as the Fund has a substantial long volatility profile. With the VIX below 13 and more than 20% below its 50-day moving average, a bounce in volatility is increasingly likely. The chart below describes the last 14 times this has occurred and the resulting move in the VIX over the following three months (the “3-Months” column depicts the percentage increase in volatility 3 months after the reference date):
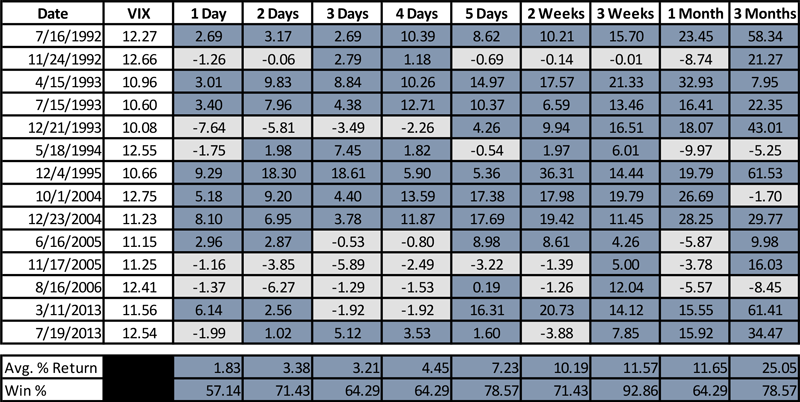
Source: Balcony Capital Partners, 2014
Considering this data, a move away from the Fund’s long volatility positioning would seem like managing the fund in the rear view mirror, which we are always keen to avoid. Be it for reasons of mean reversion or some exogenous event, we believe that volatility may soon return to the markets, and we are therefore maintaining the Fund’s long volatility positioning.
Appian Fund Performance and Positioning
The Appian Fund underperformed the HFRI Fund of Funds index in May, although it continues to outperform for the year. (1.58% versus 1.00%). The underperformance was driven mainly by weak returns by both of the Fund’s Event Driven managers. This is somewhat disappointing because the environment for Event Driven strategies is excellent. That said, many of the events managers pursue take several months to play out, and news can go against positions temporarily before the manager’s theory is proven or disproven. We believe event driven’s underperformance is a temporary issue that will correct itself. Nonetheless, we are monitoring both managers closely.
Attribution for May is as follows:
| Attribution by Strategy | |
| U.S. Long/Short Equity | 0.23% |
| Structured Credit | 0.16% |
| Tactical Currency | 0.14% |
| Global Macro | 0.11% |
| Relative Value Arbitrage | -0.05% |
| Event Driven – Special Situations | -0.05% |
| Market Neutral | -0.11% |
| Event Driven | -0.19% |
| Net Return | 0.24% |
We hope you are enjoying your summer. Please feel free to call us at any time, and we appreciate your continued interest in the Appian Fund.
Leave a Comment